Two houses of the same size are offered for sale. One has a thick insulated shell, triple glazing and a heat pump, and its heating bill is a fifth of its neighbour's. A brochure calls it zero-carbon. But it has a concrete raft, a steel frame and a great deal of foam, and its neighbour is an old timber-and-brick house that is simply sitting there. Which has put less carbon into the air? The honest answer depends on a number the brochure does not print: how much carbon went into making the new one, and when.
The previous courses taught how to reduce a building's energy use: Environmental Systems in Buildings (34/94) and Climate-Responsive & Passive Design (36/80). This course counts the other half. A graduate no longer asks only "how much energy does it use?" They ask "how much carbon, over the whole life, from the first quarry to the last demolition, and what could have been left unbuilt?"
Buildings matter for the climate on a very large scale. The UN Environment Programme and the Global Alliance for Buildings and Construction reported in March 2025 that, in 2023, buildings and construction accounted for about 32% of global energy demand and about 34% of energy- and process-related CO₂ emissions. Earlier industry estimates (the World Green Building Council, 2019) put the split at roughly 28 percentage points for running buildings and 11 for making them: the latter is called embodied carbon.
- Who takes it
- Year 4 of the Sustainable Architecture specialization of the Architecture major, and sustainability or civil engineering students. Programmes in this area, such as the Centre for Alternative Technology's built-environment MSc, teach it through a project in which a student carries out a life-cycle assessment of a building and compares options; a rating-system accreditation (LEED, BREEAM, Passivhaus designer) is a common add-on.
- What it is for
- Measuring a building's greenhouse-gas emissions across its life, so that design choices can be compared honestly, and knowing what the main green building standards do and do not measure.
- Comes after
- Environmental Systems in Buildings (34/94) and Climate-Responsive & Passive Design (36/80).
- Leads to
- No later subject lists it as a prerequisite; it feeds The Design Studio (34/96), the last step of the specialization, and pairs with Climate Science (36/14), which explains the targets these numbers are measured against.
- What this piece gives you
- You will not produce a certified assessment. You will see what the stage codes mean, why cement and steel are so carbon-heavy, how a whole-life calculation is put together, when retrofitting beats rebuilding, and what a rating really scores. Easier first reads: The Physics of the Greenhouse Effect (13/15) and Environmental Systems in Buildings (34/94).
Two carbon meters: embodied and operational
Every building has two meters running. The operational meter is the carbon from the energy used to heat, cool, light and run it, and it ticks every year until the building is gone. The embodied meter is the carbon released in making the materials, transporting them, building, repairing, replacing parts and finally taking the building apart. Most of it is spent before anyone moves in, which is why it is also called upfront carbon.
The European standard EN 15978 (2011) gives every stage a code, and the codes are used worldwide. Memorise the letters: they are the grammar of this field.
| Stage | What it covers | Meter |
|---|---|---|
| A1–A3 | Product: raw materials, transport to the factory, manufacture | Embodied (upfront) |
| A4–A5 | Transport to site and the construction process | Embodied (upfront) |
| B1–B5 | Use, maintenance, repair, replacement, refurbishment | Embodied |
| B6–B7 | Operational energy and water use | Operational |
| C1–C4 | End of life: demolition, transport, waste processing, disposal | Embodied |
| D | Benefits beyond the building's boundary (reuse, recycling potential), reported separately | Not added in |
Numbers for A1–A3 come from life-cycle assessment (LCA, standardised in ISO 14040 and 14044, 2006): you define a functional unit (say, one square metre of wall for 60 years), a boundary, list everything that goes in and out, and convert each emission to carbon dioxide equivalent (CO₂e) using global warming potentials, usually over 100 years. A manufacturer's environmental product declaration (EPD, under ISO 14025 and EN 15804) publishes that result for one product, verified by a third party, so that designers can add up a building from real data rather than averages. An EPD often covers A1–A3 only, so B, C and D must be added from scenarios.
Two cautions run through the rest of the piece. Results depend heavily on boundary and scenario choices: a 60-year study period, a 50-year one and a 100-year one give different answers for the same building, and the EU's new rules use 50. And embodied carbon is not "bad" in itself: a building that lasts 200 years spreads it thin.
Cement and steel: the carbon that chemistry puts in
Why is making materials so carbon-heavy? Partly burning fuel, and partly the chemistry. Cement starts as limestone, calcium carbonate. To make clinker it is heated to about 1,450 °C, and the reaction splits it:
Clinker is typically around 65% lime, so the limestone alone releases about 0.51 tonnes of CO₂ for each tonne of clinker, before the kiln's fuel adds roughly another 0.34 tonnes. Cement is clinker ground with gypsum and other additions, and concrete is cement plus stone, sand and water, so the carbon of a concrete floor is mostly the carbon of its cement. Estimates of cement's share of global CO₂ range up to about 8%; estimates for steel run from about 7% to 11%, depending on what is counted. Steel made from iron ore in blast furnaces releases around 1.8 tonnes of CO₂ per tonne, mostly because coke is the chemical reducing agent; steel melted from scrap in an electric arc furnace uses a fraction of that, and its carbon follows the electricity grid.
Cement's levers are therefore different from a power station's. Burning cleaner fuel helps only the 40% that is fuel. Replacing clinker with other powders that react similarly (fly ash, ground blast-furnace slag, calcined clay, ground limestone) lowers the clinker ratio. Capturing the CO₂ at the kiln is the other route, still at an early stage. Try the arithmetic.
Process CO₂ is computed from the chemistry (65% CaO in clinker, 44.01 ÷ 56.08). Fuel CO₂ is set at 0.34 t per t of clinker, a typical order of magnitude for kiln fuel. Concrete assumed to hold 300 kg of cement per m³, a round illustrative figure. The global average clinker ratio is commonly put at about 0.7 to 0.75.
Without JavaScript: at a clinker ratio of 95% a tonne of cement carries about 0.81 t of CO₂; at 72% about 0.61 t; at 50% about 0.43 t. With 90% of the kiln's CO₂ captured at 72% it is about 0.06 t.
The practical limits are real. Slag and fly ash are by-products of blast furnaces and coal power stations, which are the very industries being phased out, so their supply may shrink. Calcined clay and limestone cements (such as LC3, developed with researchers in Switzerland, Cuba and India) draw on materials found nearly everywhere. Cement is also cheap and local, and a concrete mix is a safety-critical product: codes and engineers change slowly, for good reasons.
Counting a house: quantities times factors, over time
A life-cycle calculation is a bill of quantities multiplied by carbon factors, then a time series. Each material's factor is in kilograms of CO₂e per kilogram: in the widely used Inventory of Carbon and Energy (ICE) database (Hammond and Jones, University of Bath), as reproduced in public summaries, general concrete is about 0.16, common brick 0.24, steel with average recycled content 1.37, timber 0.46 (leaving out the carbon the tree absorbed) and rock-wool insulation 1.05. Multiply by the kilograms in your building.
Timber is the contested entry. A tree takes CO₂ out of the air as it grows, roughly 1.6 kg of CO₂ stays locked in each kilogram of dry timber, and that carbon stays out of the air while the timber is in a building. Standard practice (EN 15804) reports this biogenic carbon separately, because the credit disappears if the timber is burned or rots at end of life, and because it only counts if the forest regrows or the harvest does not shrink the forest. Timber-building advocates and some forest ecologists weigh this differently. Try the calculation with and without it.
Quantities in kg per m² of floor are invented round numbers; factors are the ICE values listed above. "Other" (windows, finishes, services) is a fixed 40 kg CO₂e/m². Transport and construction (A4–A5) is taken as 12% of A1–A3, replacement and maintenance (B2–B5) as 20% of A1–A3 over 60 years, and end of life (C) as 5%, all illustrative. Stored carbon is released again at end of life.
Without JavaScript: for the masonry house with standard insulation, A1–A3 is about 302 kg CO₂e per m² of floor. The timber-frame house with the same insulation is about 178, with another 192 kg of CO₂ held in its timber while it stands.
Now add the second meter. Operational carbon is the annual energy times the carbon intensity of that energy. A gas boiler burns fuel at about 0.2 kg CO₂ per kWh of gas (the IPCC default factor for natural gas is about 56 kg per gigajoule), so its carbon is fixed by chemistry. A heat pump delivers about three units of heat per unit of electricity, but its carbon depends on the grid: from a few tens of grams of CO₂ per kWh where hydro, nuclear or wind dominate, to several hundred where coal does. Grids are decarbonising, so the same house emits less in each later year. That changes the sum.
Uses the house chosen in the previous card. Heating demand 60, 30 or 15 kWh/m² a year for the three insulation levels, plus 25 kWh/m² of electricity for hot water and appliances; boiler 90% efficient at 0.202 kg CO₂ per kWh of gas; heat pump seasonal efficiency 3.0 (illustrative); grid falls linearly then stays flat. Module D and the benefits of renewable electricity are left out. Results swing with every assumption: read the shapes.
Without JavaScript: the masonry house with standard insulation and a heat pump, on a grid of 300 g/kWh falling 60% over 25 years, totals about 835 kg CO₂e per m² over 60 years: about 414 embodied and 421 operational, so embodied carbon is half of the total and operations catch up only in year 59. On gas the same house totals about 1,456, 28% of it embodied.
Two lessons come out of every run. The cleaner the energy, the larger the embodied share, and for a very efficient building on a clean grid it is the majority. And the carbon spent in the first year weighs differently from carbon spent in year 50: climate targets work to budgets and deadlines, so a tonne now is worth more avoided than a tonne later. That is the argument for focusing on upfront carbon first, and why a heavy-insulation, heavy-materials design is not automatically a win.
Retrofit or rebuild: the greenest building is usually the one already built
The architect Carl Elefante, later president of the American Institute of Architects, has used the line "the greenest building is the one that is already built" since about 2007. The idea is simple: an existing building's embodied carbon has already been spent and can't be refunded by demolishing it. A new building starts in debt. A study by the US National Trust's Preservation Green Lab, The Greenest Building (2011), analysed building types in several US cities and concluded that reuse generally beats demolition and new construction, and that even a new efficient building takes decades to repay the carbon of its materials.
Critics and careful defenders agree on the caveats. Some old buildings can't be insulated well, are unsafe in earthquakes or fire, or no longer suit the use, and a new building designed for a very long life, to be taken apart and reused, spreads its embodied carbon over many generations. A very efficient new building on a clean grid can overtake a mediocre retrofit eventually. The fair statement is that the break-even depends on the three numbers below, and that the first decade almost always favours keeping what is there.
Invented example per m² of floor: the existing building needs 150 kWh/m² a year for heating, the retrofit 40, the new build 15. Gas boiler 90% efficient or a heat pump with seasonal efficiency 3.0. The new building starts with its embodied carbon, the retrofit with its own, and each then adds its heating carbon every year. Hot water and appliances are the same in all three and left out.
Without JavaScript: with the default numbers on gas, after 10 years the cumulative carbon is about 337 kg/m² (do nothing), 190 (retrofit) and 384 (rebuild); the rebuild only passes the retrofit after about 45 years and ends at about 552 against 639 for the retrofit and 2,020 for doing nothing. With a heat pump the rebuild never catches the retrofit within 60 years.
Notice also what the chart says about doing nothing on a clean grid: with a heat pump on a 300 g/kWh grid the old building emits about a quarter as much over 60 years as it would on gas, and the retrofit's own carbon takes roughly a decade of savings to repay. Retrofit is not free either.
Ratings and rules: what each system actually measures
"Green building" is not one standard. The certification schemes were built by different countries for different jobs, and what they score is not the same. A graduate knows which question each one answers.
| System | Origin | What it scores |
|---|---|---|
| LEED | US, USGBC, 1998 | Points across categories (energy, water, materials, indoor quality, location); Certified 40+, Silver 50+, Gold 60+, Platinum 80+ |
| BREEAM | UK, BRE, 1990 | Weighted percentage across management, health, energy, transport, water, materials, waste, ecology, pollution; Pass to Outstanding |
| DGNB | Germany, 2009 | Quality of the whole life: ecological, economic, socio-cultural and technical, with a life-cycle assessment in the ecology part |
| Passivhaus | Germany, Passive House Institute | A measured energy target: about 15 kWh/m² a year of heating, airtightness of at most 0.6 per hour at 50 Pa (see 36/80) |
| EDGE | IFC (World Bank Group), 2013 | At least 20% less energy, water and embodied energy in materials than a local baseline; used widely in emerging economies |
| Green Star | Australia, GBCA, 2003 | Star ratings across categories such as energy, materials, indoor environment and emissions; adapted in other countries |
| CASBEE | Japan, 2002 | A ratio, BEE = quality of the indoor environment ÷ load on the outside environment |
Two patterns matter. First, most ratings are checklists of design features and early on rewarded energy modelled at design stage rather than measured in use; the gap between predicted and measured energy use of real buildings is a well-documented finding (de Wilde, 2014). Newer versions of several schemes add embodied-carbon credits. Second, only some say anything about total carbon: Passivhaus fixes a number for energy but not for materials, and EDGE adds a materials criterion in a simple pass-or-fail form. EDGE projects report their gains: a bank's headquarters in Tanzania reported 21% less energy, 27% less water and 28% less embodied carbon in materials than its baseline, and a factory in Brazil reported 30%, 33% and 60% on its three measures. These are self-reported design results.
Regulation is catching up with certification. The EU's 2024 recast of the Energy Performance of Buildings Directive (Directive (EU) 2024/1275) requires whole-life-cycle global warming potential to be calculated and disclosed for new buildings over 1,000 m² from 1 January 2028 and for all new buildings from 2030, as kilograms of CO₂e per square metre over a 50-year reference period, with a roadmap towards limit values. France (RE2020, in force from 2022), Sweden (climate declarations for new buildings from 2022) and Denmark (limit values from 2023) went earlier; outside Europe, national schemes such as China's Assessment Standard for Green Building (GB/T 50378) and Colombia's 2015 sustainable-construction resolution cover energy and water more than whole-life carbon.
Circular construction: reuse before recycling, recycling before disposal
Module D is where circularity shows up in the accounting. It counts what happens beyond the building: steel that is recycled, bricks that are reused, timber that becomes fuel or another beam. Reported separately, it keeps a building from claiming credit twice, and it rewards designs that make reuse possible: bolted rather than welded steel, mechanical joints instead of glue, lime mortar that lets bricks be cleaned and reused, and a materials passport that records what is in a building and where. The hierarchy is the same one as for waste: avoid, then reuse, then recycle, then dispose.
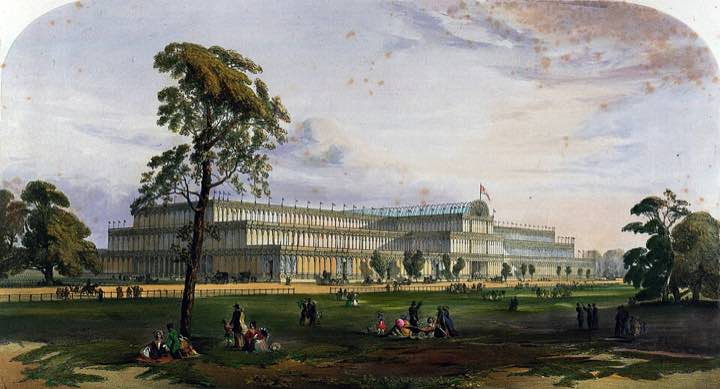

Reuse has an old history and a thin modern market: salvaged structural steel needs testing and certification; reclaimed materials need a place to be stored; and a designer carries the liability. Several countries are working on these barriers, and the EU's Level(s) framework (2020) lets building projects report life-cycle carbon, circularity and other measures on one common footing. Whether this becomes routine or stays a specialist's craft is open.
The same logic goes back to the design of the building itself. The cheapest carbon to remove is the carbon of the material never bought: a smaller building, a plan that uses less structure, a floor that is not poured. Passive design from the previous course lowers operations; this course tells you which of those measures pays back its own materials. The earth, bamboo and timber of Earth Building (36/81) and Bio-based Building (36/82) lower the first meter, and the retrofit lowers neither as much as a building that is not needed.
What a graduate just sees
- Every building has two carbon meters, and the stage codes (A1–A5, B, C, D) say which one is running.
- Cement's carbon is mostly chemistry, not fuel, so lowering the clinker ratio matters more than burning cleaner fuel.
- A bill of quantities times a carbon factor is the whole method; the hard part is the boundary and the scenarios.
- The cleaner the grid, the larger the embodied share, so efficient buildings are mostly their own materials.
- Carbon spent early counts for more than carbon spent late, which is why upfront carbon matters.
- Keeping and upgrading a building usually beats demolishing it, but the break-even depends on the retrofit, the new build and the grid.
- A rating is a lens: LEED, BREEAM, DGNB, Passivhaus, EDGE, Green Star and CASBEE each measure something different, and most measure design intent, not carbon in use.
- The greenest square metre is often the one that is not built.
Where it shows up next
- The Design Studio (34/96): the final project of the specialization, where the choices are justified with a whole-life number.
- Climate Science (36/14): the carbon budget and the 2030 and 2050 deadlines behind the weight given to upfront carbon.
- Earth Building (36/81) and Bio-based Building (36/82): the low-carbon materials whose figures this course teaches you to read and question.
- In the world: whole-life-carbon requirements in European building codes, EDGE-certified housing and offices in Africa, Latin America and South Asia, retrofit programmes for postwar housing blocks, and procurement rules that ask for EPDs.
If you want to go deeper
- 📘 Textbook. The RICS professional standard, Whole life carbon assessment for the built environment (2nd edition, 2023), the reference method for the stages and the reporting; free to download from rics.org.
- 📘 Textbook. Michael Z. Hauschild, Ralph K. Rosenbaum and Stig Irving Olsen, Life Cycle Assessment: Theory and Practice (Springer, 2018), for the method behind the numbers.
- 📘 Gentler. Bill Gates's How to Avoid a Climate Disaster (2021) has a clear chapter on cement and steel; and Michael Green's report The Case for Tall Wood Buildings (2012) argues the timber case.
- 🌐 Free resources. The UN Environment Programme and Global ABC Global Status Report for Buildings and Construction, the LETI Embodied Carbon Primer (free), and the Carbon Leadership Forum's open EC3 tool for comparing EPDs.
A building's carbon is two bills: the one paid up front to make it and the one paid in instalments to run it. As the instalments shrink, the up-front bill dominates, so the order of attack is to avoid building, then to reuse and retrofit, then to build lean with low-carbon materials, and only then to count the rest and certify it.
Try this: pick a building you know and list what is in it by weight: concrete, brick, steel, timber, glass. Multiply the heaviest two by the factors above. Then ask how many years of its heating that carbon equals. That is the number most brochures leave out.
Sources. EN 15978:2011 and EN 15804 (life-cycle stages and product declarations); ISO 14040 and 14044 (2006), ISO 14025; UNEP and GlobalABC, Global Status Report for Buildings and Construction 2024/2025 (March 2025); World Green Building Council, Bringing Embodied Carbon Upfront (2019); Hammond and Jones, Inventory of Carbon and Energy (ICE), values as listed in Wikipedia's "Embodied energy"; IPCC 2006 Guidelines default emission factors; Directive (EU) 2024/1275; Preservation Green Lab, The Greenest Building (2011); de Wilde, "The gap between predicted and measured energy performance of buildings," Automation in Construction 41 (2014); descriptions of LEED, BREEAM, DGNB, Green Star and CASBEE from the schemes' own organisations and Wikipedia; IFC EDGE project reports for CRDB (Tanzania) and a Lindal plant (Brazil).
- 📘 RICS, Whole life carbon assessment for the built environment
- 🌐 UNEP and GlobalABC, Global Status Report for Buildings and Construction
- 🌐 LETI, Embodied Carbon Primer